

R-View
UX Design
Design a user-friendly and visually appealing Ratings and Reviews dashboard tailored for internal use, particularly data analysts. The dashboard should be self automated providing seamless and intuitive user experiences (UX) while adhering to best practices in user interface (UI) design.


Initial image inspiration
Tools:
Adobe Photoshop
Adobe Illustrator
Adobe XD
Platform:
Microsoft PowerBI


Key Features:
Automated Data Integration:
Automatically pull and update ratings and reviews from various platforms. Real-time data synchronisation.
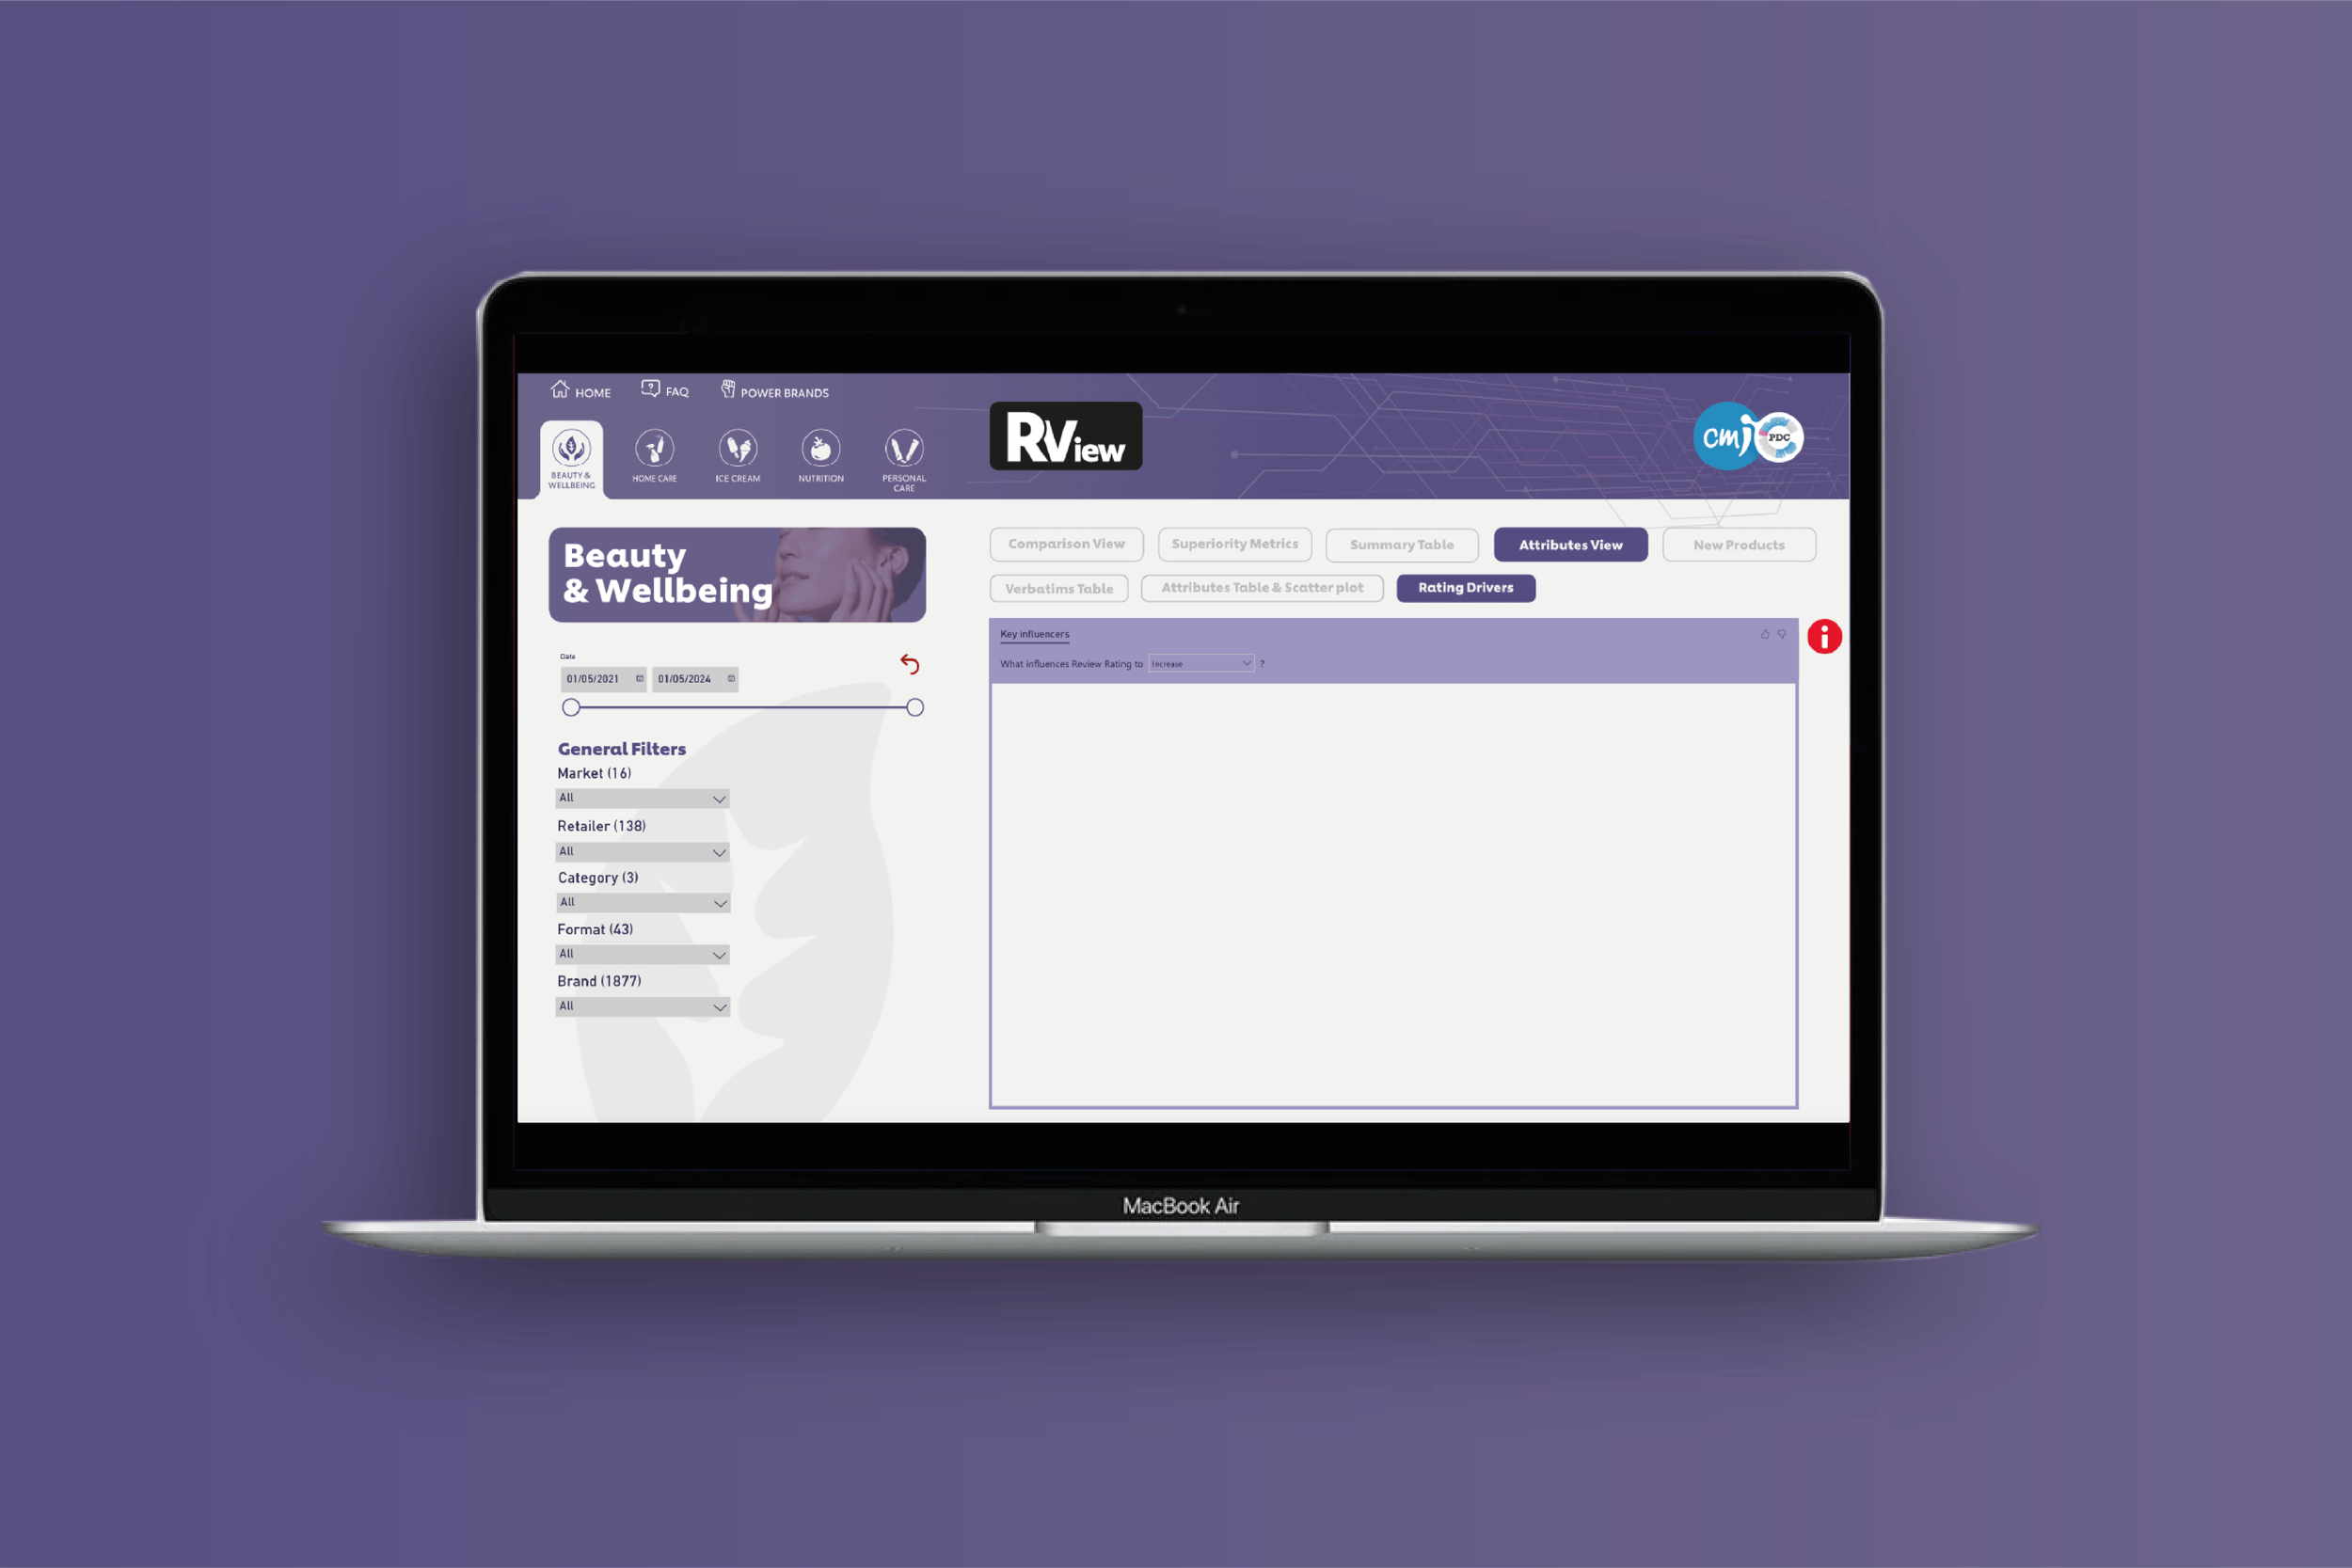
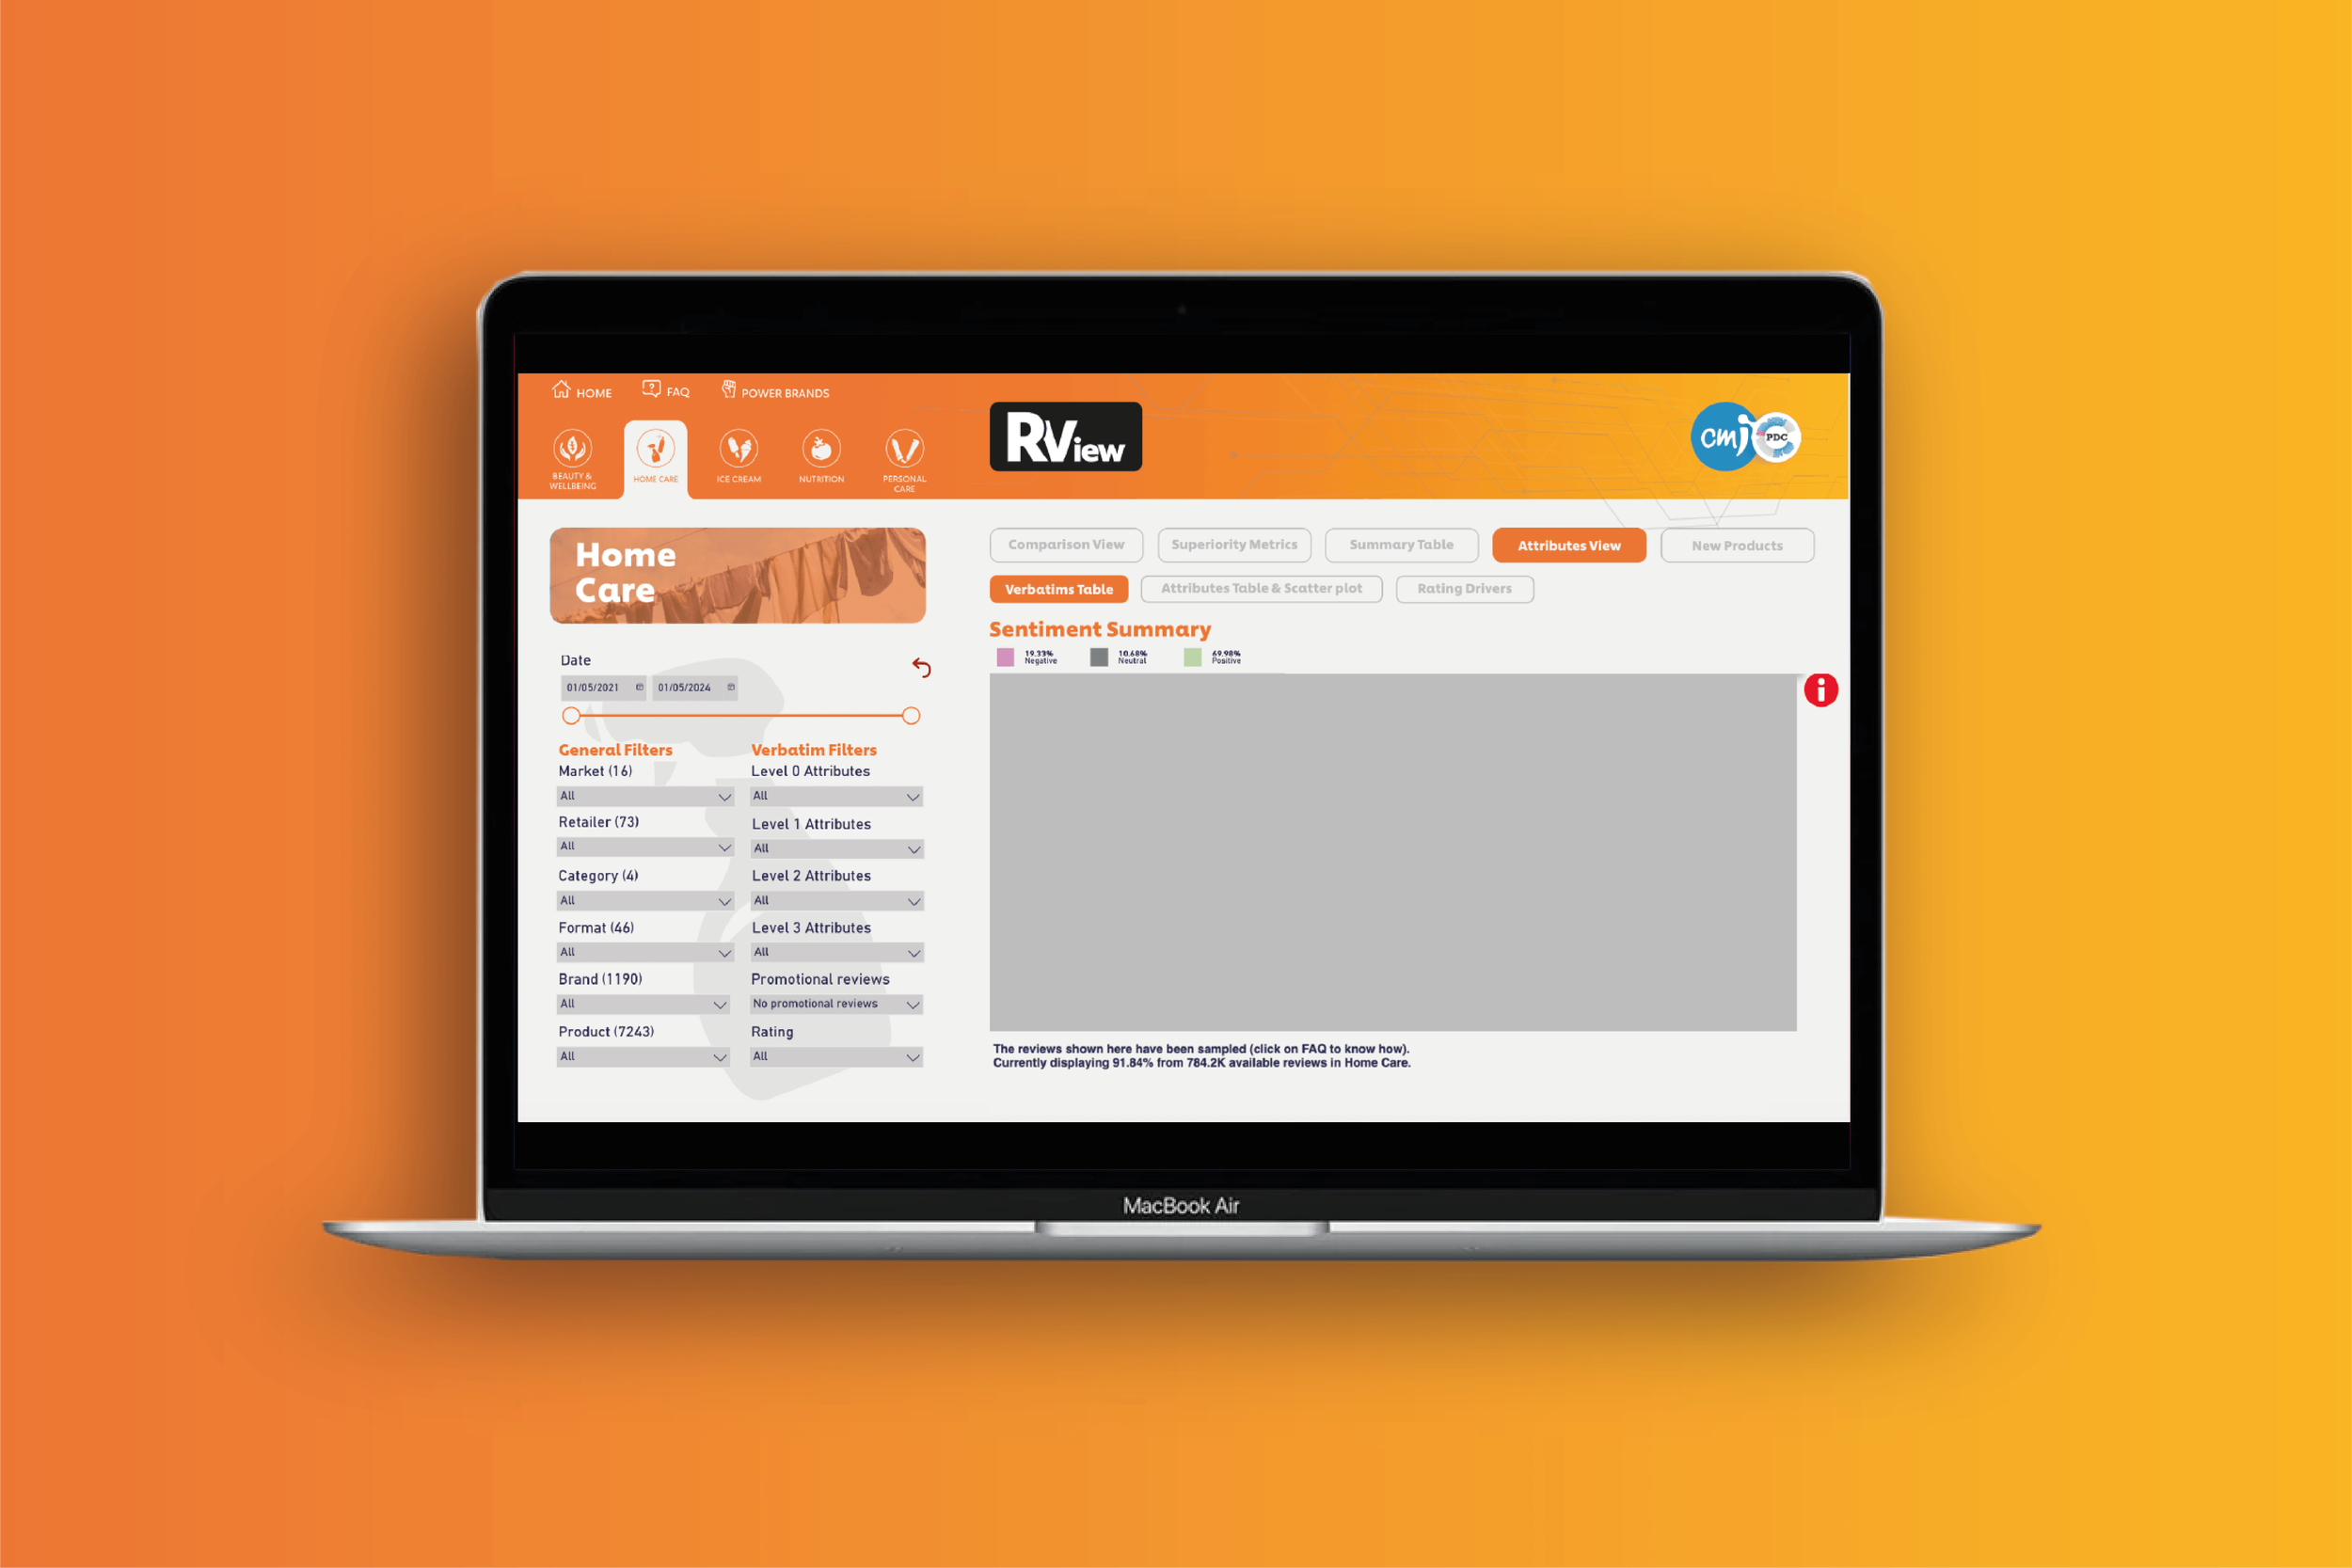
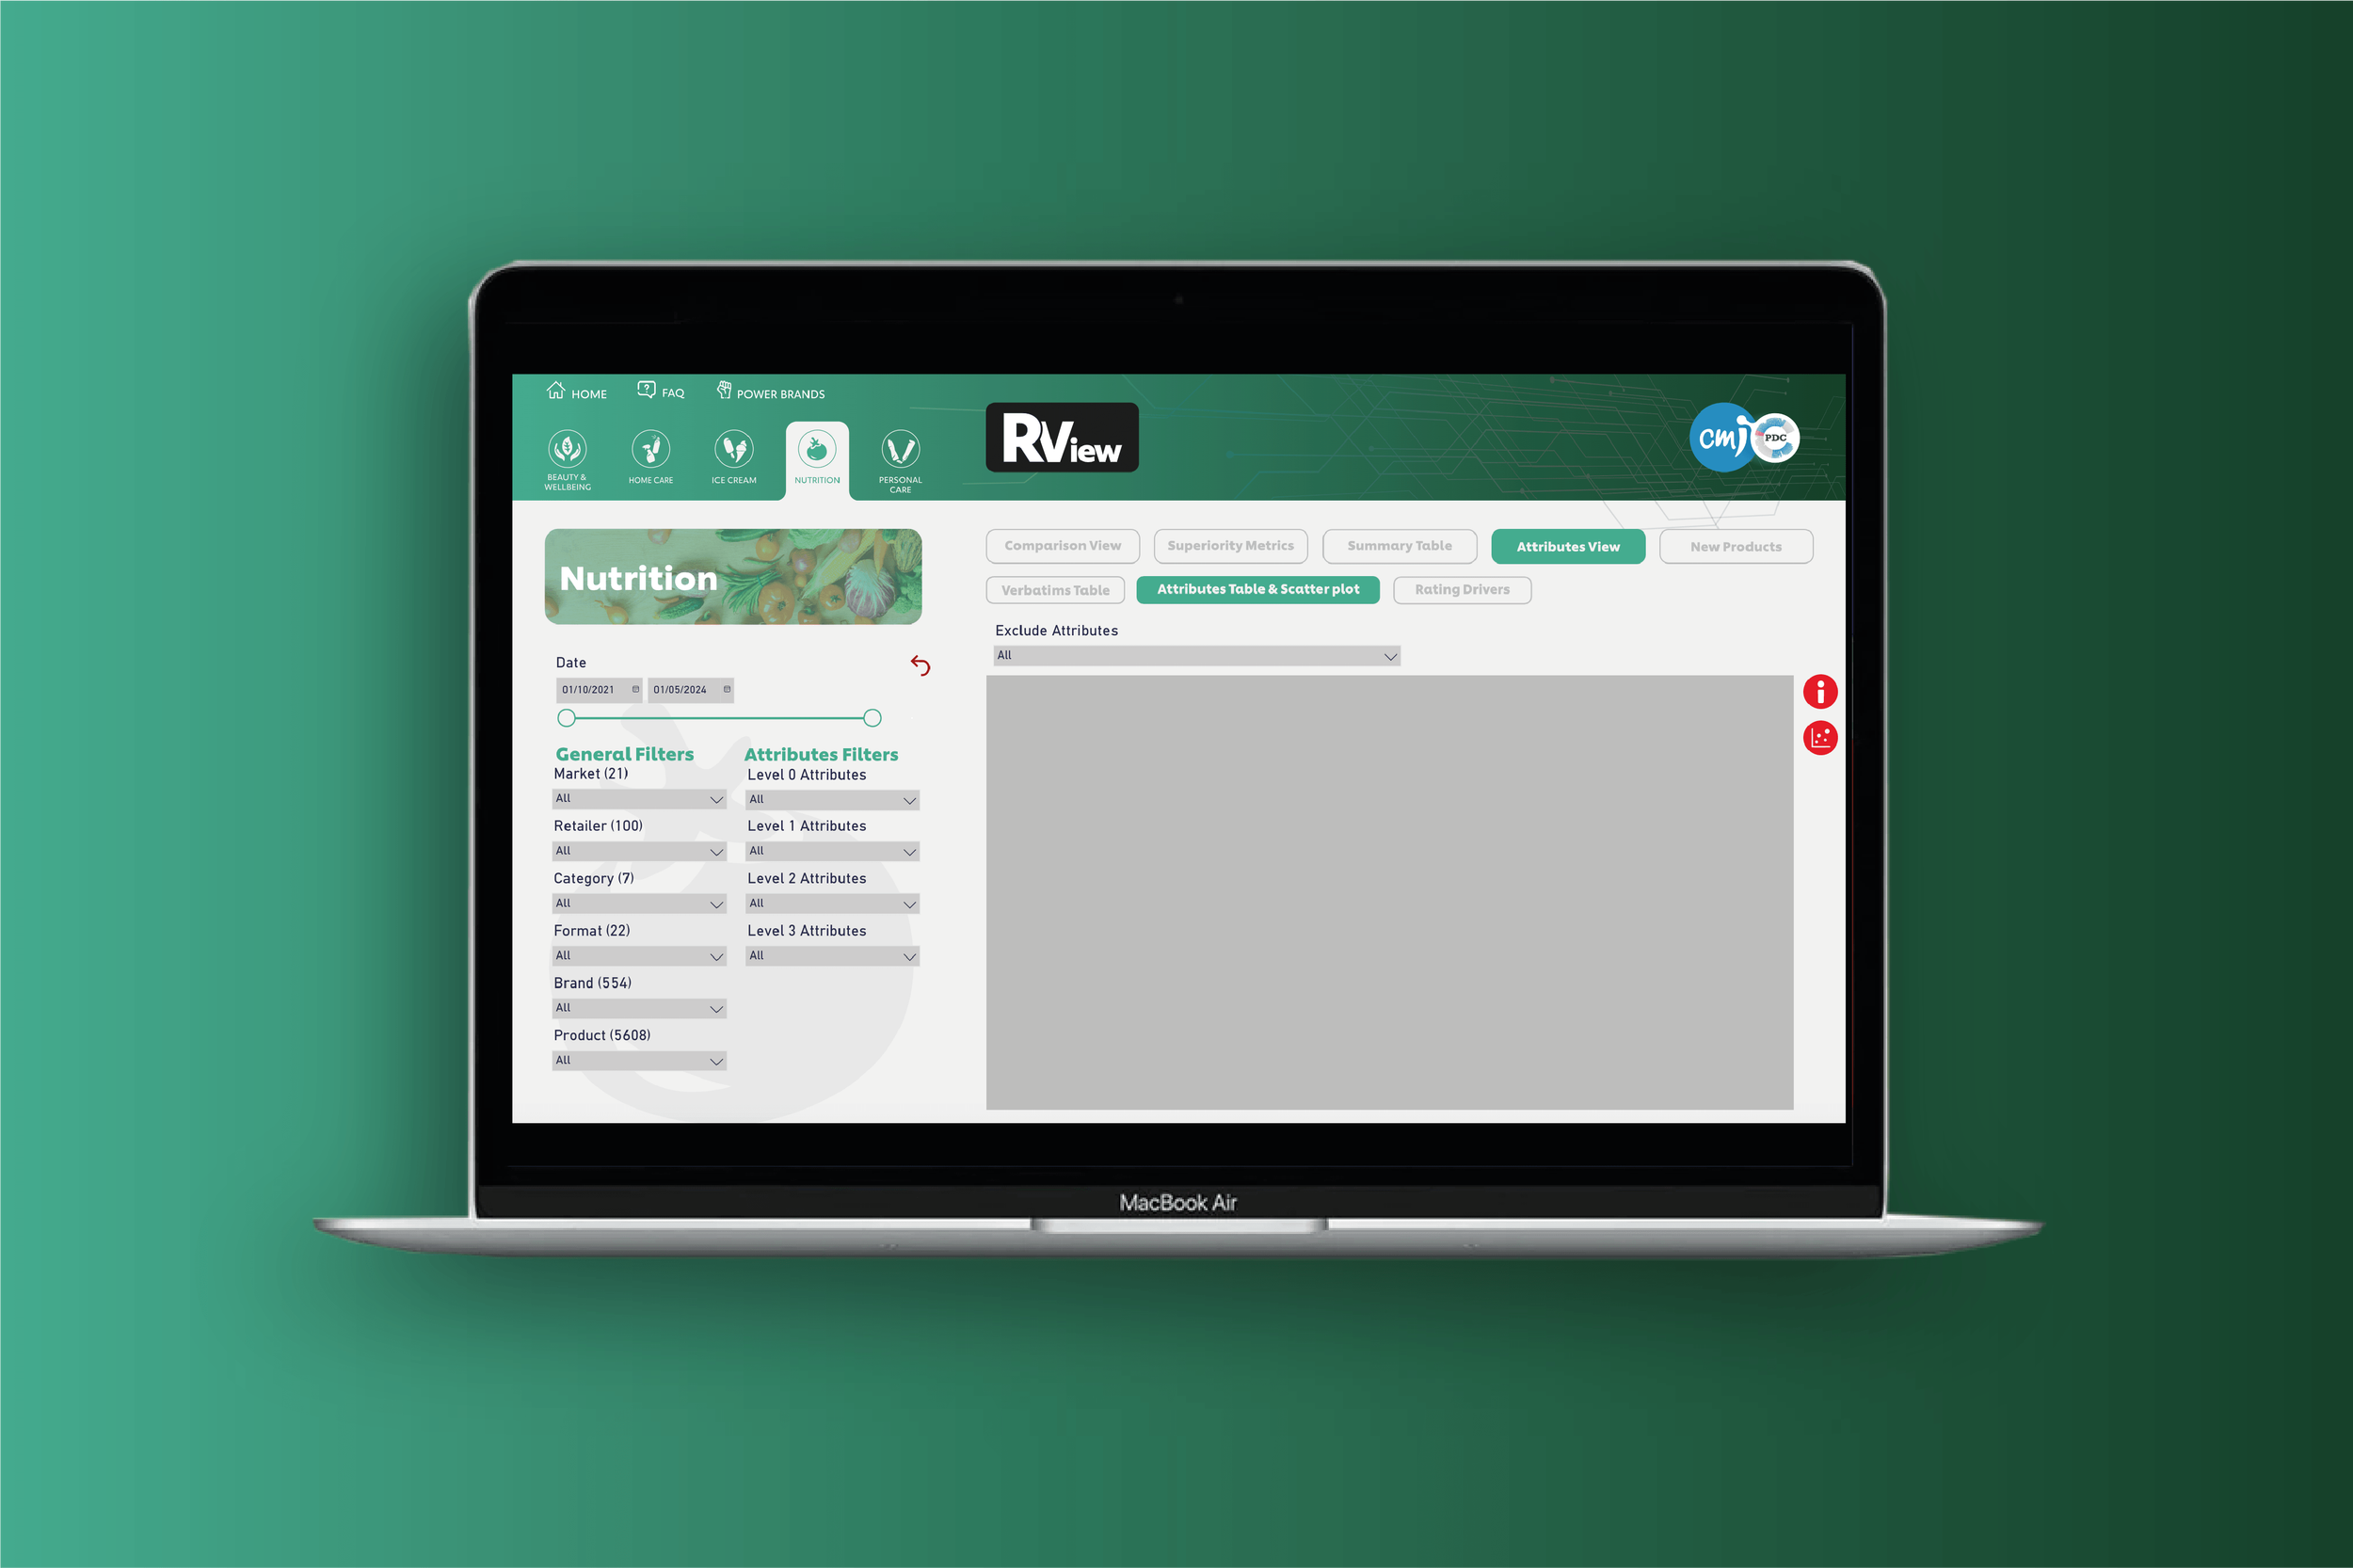
Rating & Review Visualisation:
Use visual elements (graphs, charts, heat maps) to present ratings and review trends. Highlight key metrics such as average rating, top-reviewed projects, and reviewer demographics.
Search & Filter Options:
Allow users to search and filter reviews by date, rating, project type, and reviewer.
User Interface (UI) Elements:
Design a clean, modern, and intuitive interface with easy navigation. Ensure responsive design for various devices (desktops, tablets, and mobile).
User Journey & Wireframes
In the early stages of the project, I focused on creating wireframes for each view, ensuring the user journey was intuitive. With multiple features in mind, I also considered how users would move between pages. I worked closely with the team to thoroughly understand the service and anticipate issues, then presented the wireframes to the client for approval.
The goal was to design an interface that would organise data for easy transfer into reports. Upon completion, we delivered a detailed UX package, outlining button hierarchy, colour codes, and data visualisation examples.
N.B. Some examples of data have been hidden due to privacy restrictions.


The Outcome
The results for the dashboard and branding were significant. There has been a big increase in engagement and user retention. Workshops were conducted where feedback was received where users specifically highlighted the ease of use and visual appeal where they could access and download their data points with no issues. More features have been added in a phased approach to make the tool more efficient and comprehensive. Going on to be entered into the Market Research Society Awards and winning the Best Data Solution Award.